Tutorial & Methods
MEA Viewer Functions
1. BrainWave4 .brw HDF5 Files (3Brain - BioCAM-X Measurement):
- This module shows the data explorer funcitons in the Xenon LFP Analysis Platform. A quick look at the function is demonstrated in the video below.
In the below section we will go over the steps highlighted in the video to explore data, generate raster plots, apply digital filters, view full traces as a time series, generate spectrum plots, and spectral density corresponding to different frequency bands.
Getting started:
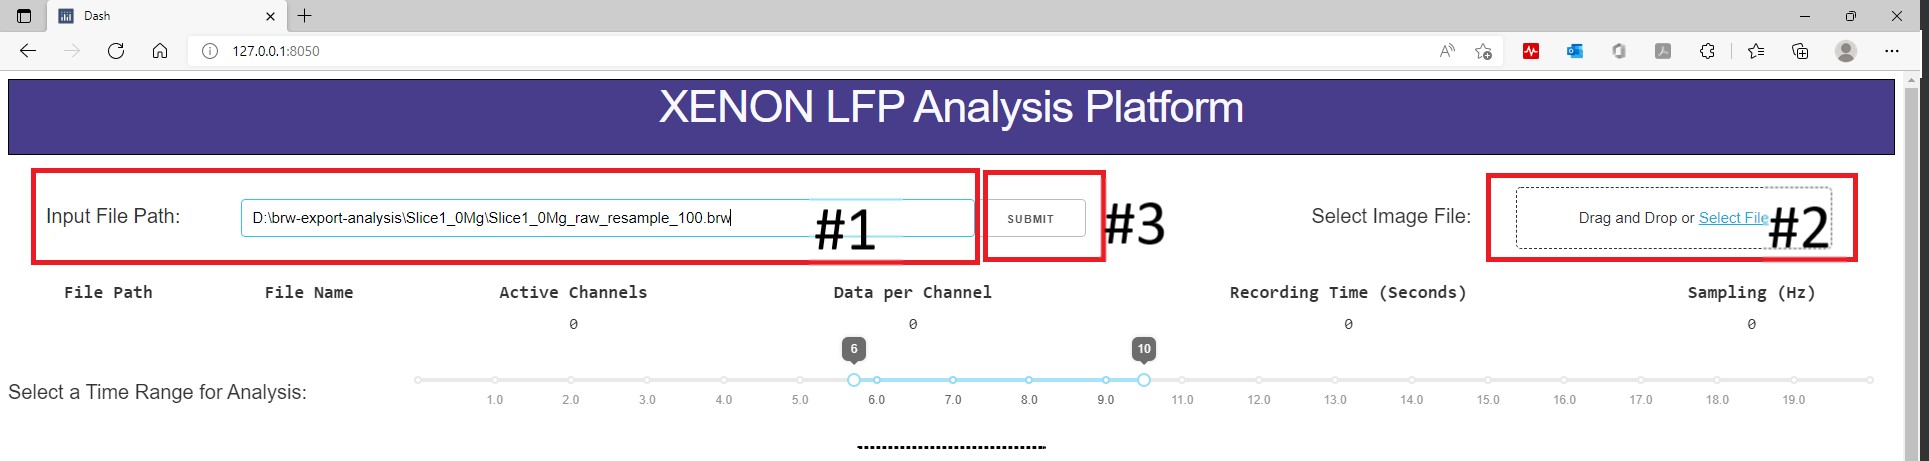
Input the file path, select the image file to start, and click submit.
Input File: Copy and paste the full input file path (#1)
Select the location of the image file (#2) (Optional)
If you are not using an image file, click ‘SUBMIT’ (#3)
MEA Group Functions
1. BrainWave4 .brw HDF5 Files (3Brain - BioCAM-X Measurement):
The channel group functions are aimed at comparing two or three different regions of the slice, and compare LFP activity summary measures, while also generating a raster plot to study difference in activity pattern in different regions. The analysis starts with the Channels Groups tab (see below video). Channels groups can be selected by clicking on channels or by using the box or lasso draw tool to select multiple channels at the same time. The groups tab enables selecting channels under three groups (Group1, Group 2, and Group3). The channels for each group are selected under their respective tab. Once respective groups and channels are selected, analysis settings can be modified from the default followed by clicking on Apply Setting and Generate Plots, which generates the raster plots and summary measures.
MEA Seizure Detection Functions
1. BrainWave4 .brw HDF5 Files (3Brain - BioCAM-X Measurement):
The channel group raster is required to perform the seizure detection and analysis. Each group has a separate tab under which individual channels can be selected to view seizure-like activity highlighted by an envelop. Using the raster a time region can be selected with a potential SLE, as shown in the below video. This automatically generates the summary measures and a visual of the channels that have a SLE for each group. Individual channels in each group can also be selected to explore the detected envelop.